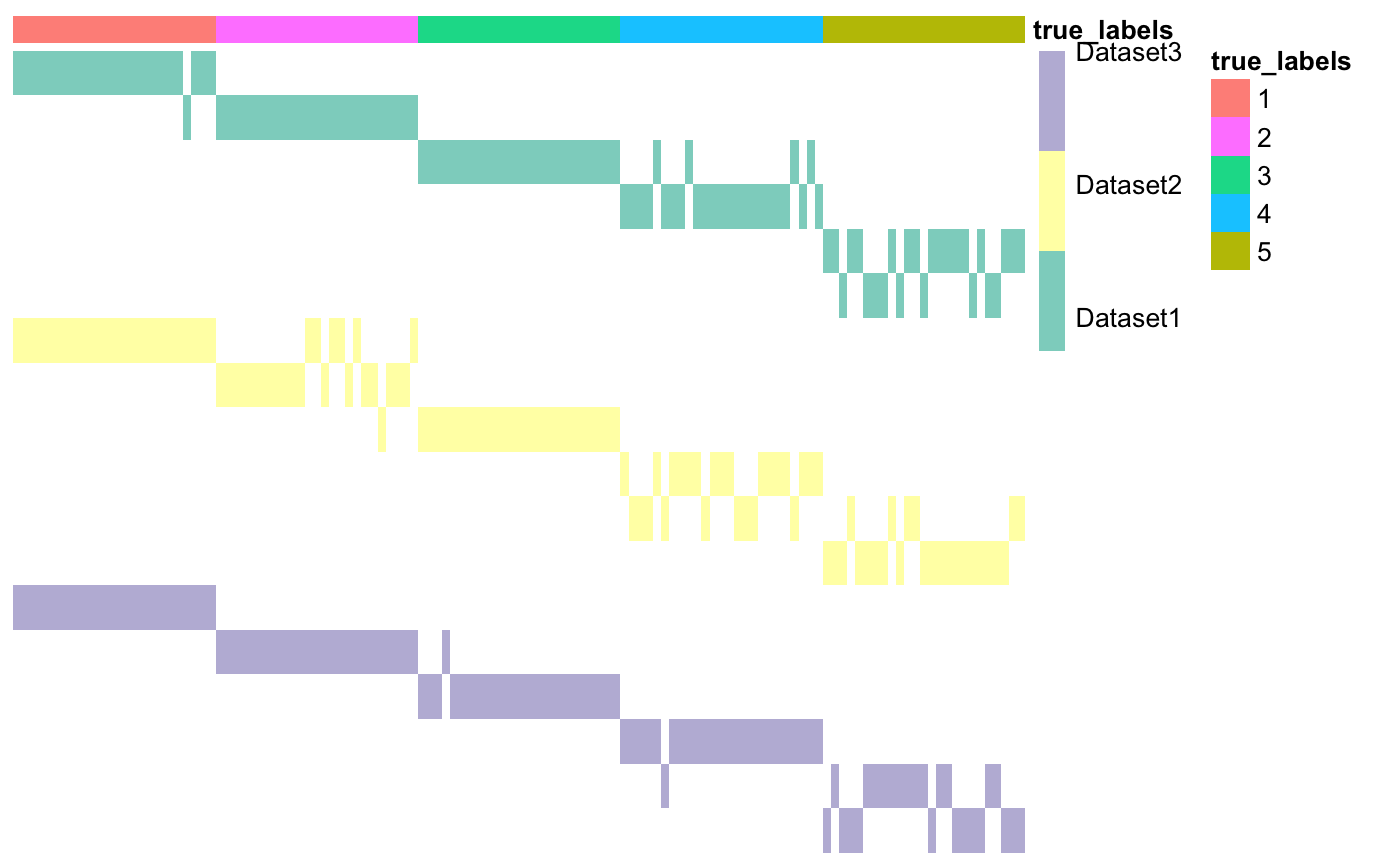
This function creates a matrix of clusters, starting from a list of heterogeneous datasets.
plotMOC(
  moc,
  datasetIndicator,
  datasetNames = NULL,
  annotations = NULL,
  clr = FALSE,
  clc = FALSE,
  savePNG = FALSE,
  fileName = "moc.png",
  showObsNames = FALSE,
  showClusterNames = FALSE,
  annotation_colors = NA
)
Arguments
| moc | Matrix-Of-Clusters of size N x sumK. |
|---|---|
| datasetIndicator | Vector containing integers indicating which rows correspond to some clustering of the same dataset. |
| datasetNames | Vector containing the names of the datasets to which each column of labels corresponds. If NULL, datasetNames will be the same as datasetIndicator. Default is NULL. |
| annotations | Dataframe containing annotations. Number of rows must be
N. If the annotations are integers, use |
| clr | Cluster rows. Default is FALSE. |
| clc | Cluster columns. Default is FALSE. |
| savePNG | Boolean. If TRUE, plot is saved as a png file. |
| fileName | If |
| showObsNames | Boolean. If TRUE, the plot will also include the column names (i.e. name of each observation). Default is FALSE, since there are usually too many columns. |
| showClusterNames | Boolean. If TRUE, plot cluster names next to corresponding row. Default is FALSE. |
| annotation_colors | Optional. See annotation_colors in pheatmap::pheatmap. |
References
The Cancer Genome Atlas, 2012. Comprehensive molecular portraits of human breast tumours. Nature, 487(7407), pp.61–70.
Examples
# Load data
data <- list()
data[[1]] <- as.matrix(read.csv(system.file("extdata", "dataset1.csv",
package = "coca"), row.names = 1))
data[[2]] <- as.matrix(read.csv(system.file("extdata", "dataset2.csv",
package = "coca"), row.names = 1))
data[[3]] <- as.matrix(read.csv(system.file("extdata", "dataset3.csv",
package = "coca"), row.names = 1))

# Create vector of dataset names, in the same order as they appear above
datasetNames <- c("Dataset1", "Dataset2", "Dataset3")

# Build matrix of clusters
outputBuildMOC <- buildMOC(data, M = 3, K = 6, distances = "cor")

# Extract matrix of clusters and dataset indicator vector
moc <- outputBuildMOC$moc
datasetIndicator <- outputBuildMOC$datasetIndicator

# Prepare annotations
true_labels <- as.matrix(read.csv(
system.file("extdata", "cluster_labels.csv", package = "coca"),
row.names = 1))
annotations <- data.frame(true_labels = as.factor(true_labels))

# Plot matrix of clusters
plotMOC(moc,
        datasetIndicator,
        datasetNames = datasetNames,
        annotations = annotations)