Mixtures of univariate Gaussian distributions
Alessandra Cabassi
2019-04-01
univariate-mixtures.Rmdlibrary(vimix)
## Load a dataset containing 200 2-dimensional data points
data <- c(rnorm(1000,-3), rnorm(1000,3))
## Use variational inference for mixture of Gaussians to find clusters
output <- vimix(data, 10)## Plot cluster labels
library(ggplot2)
library(broom)
library(gridExtra)
## Convert data matrix and cluster labels to data.frame
data <- tidy(data)
data$label <- as.factor(output$label)
## Plot clusters
ggplot(data, aes(x = x, col = label)) + geom_histogram()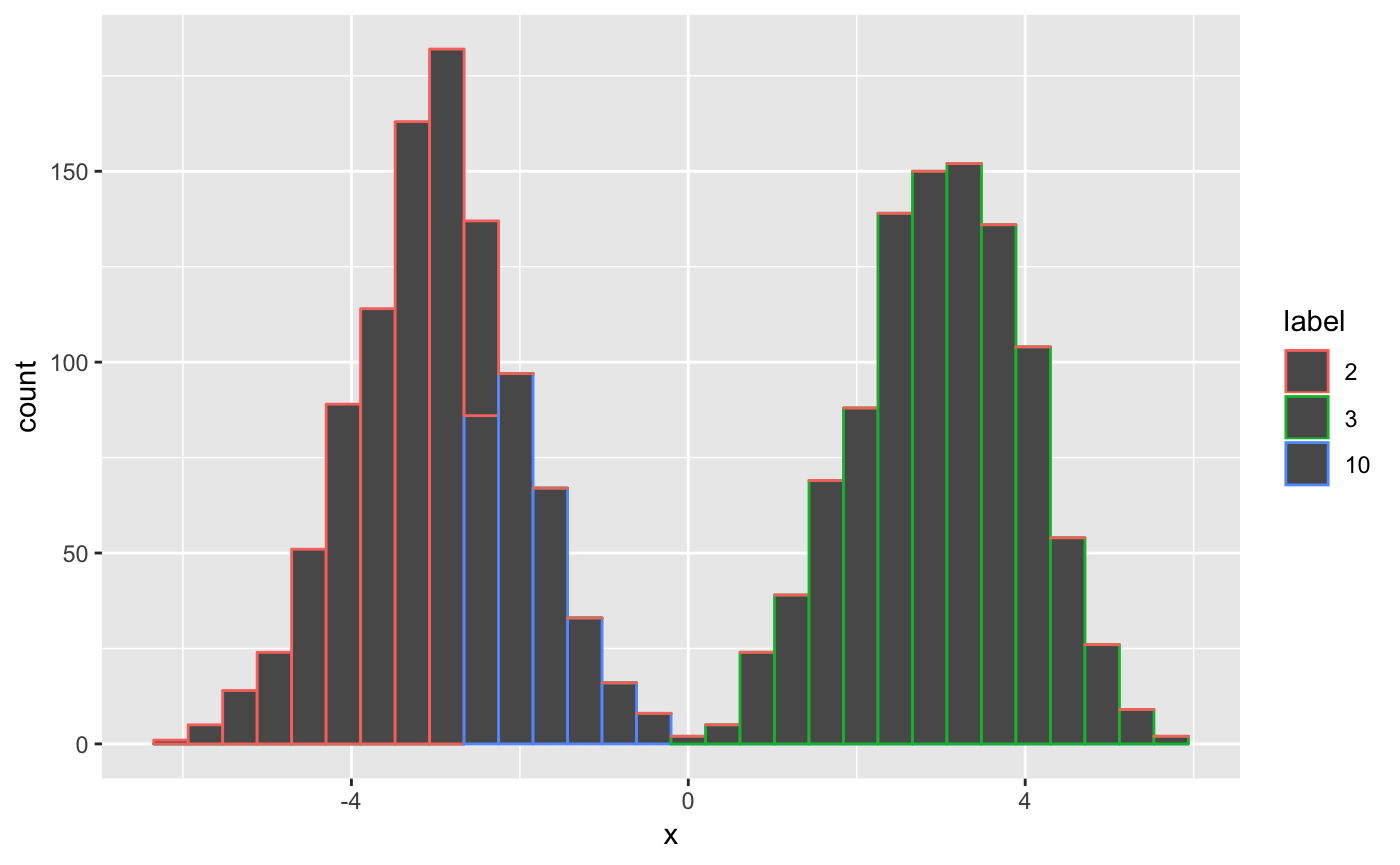
## Check that the lower bound is monotonically increasing

lb <- tidy(output$L[-1])
lb$ELBO <- lb$x
lb$x <- NULL
lb$iter <- c(1:length(output$L[-1]))
lb$number_clusters <- output$Cl[-1]

## Plot clusters
plot_lb <- ggplot(lb, aes(x=iter,y=ELBO)) + geom_line(linetype = "dashed") + geom_point()

## Plot number of non-empty clusters
plot_nc <- ggplot(lb, aes(x=iter,y=number_clusters)) + geom_line(linetype = "dashed") + geom_point()

grid.arrange(plot_lb, plot_nc, ncol = 2)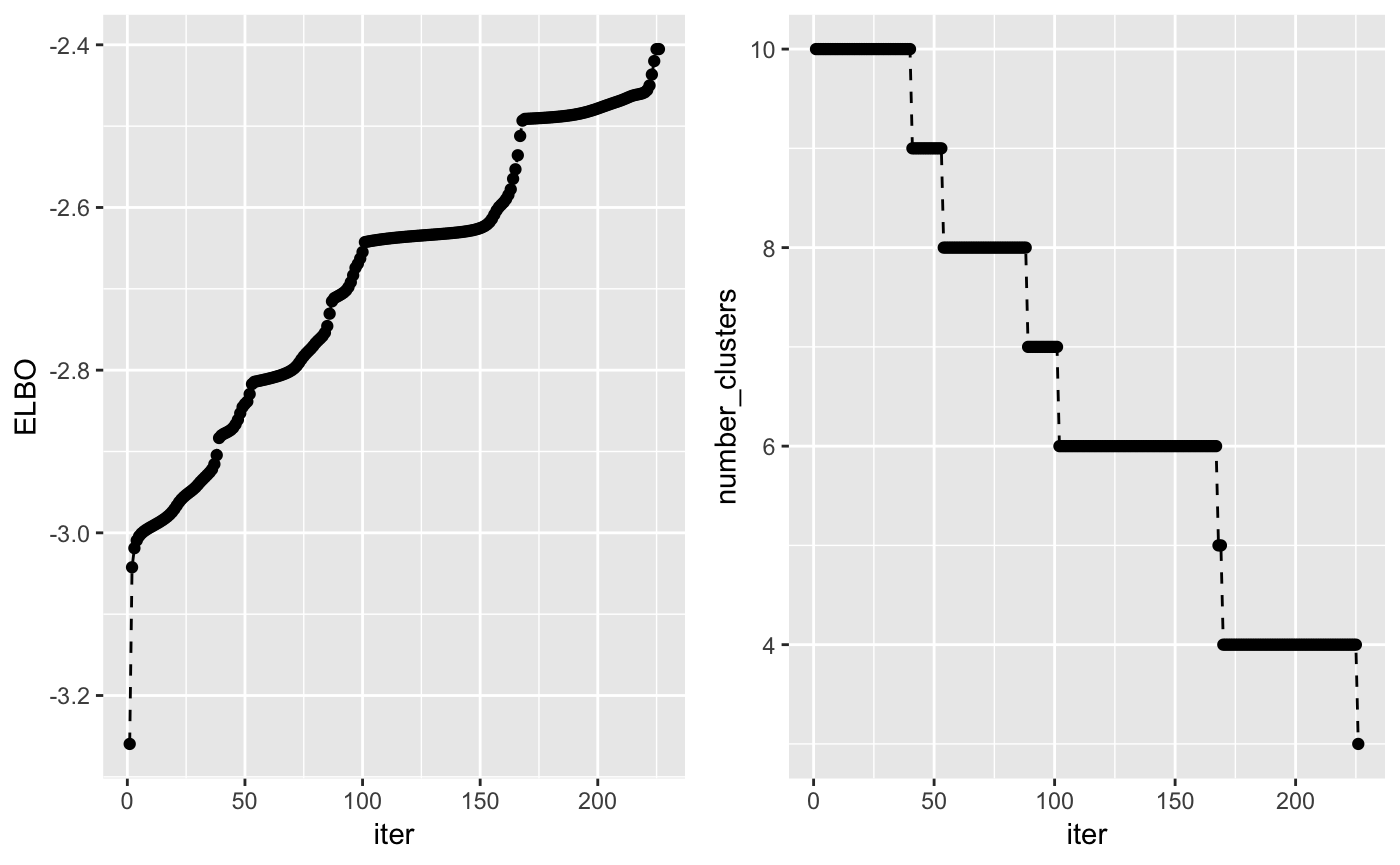
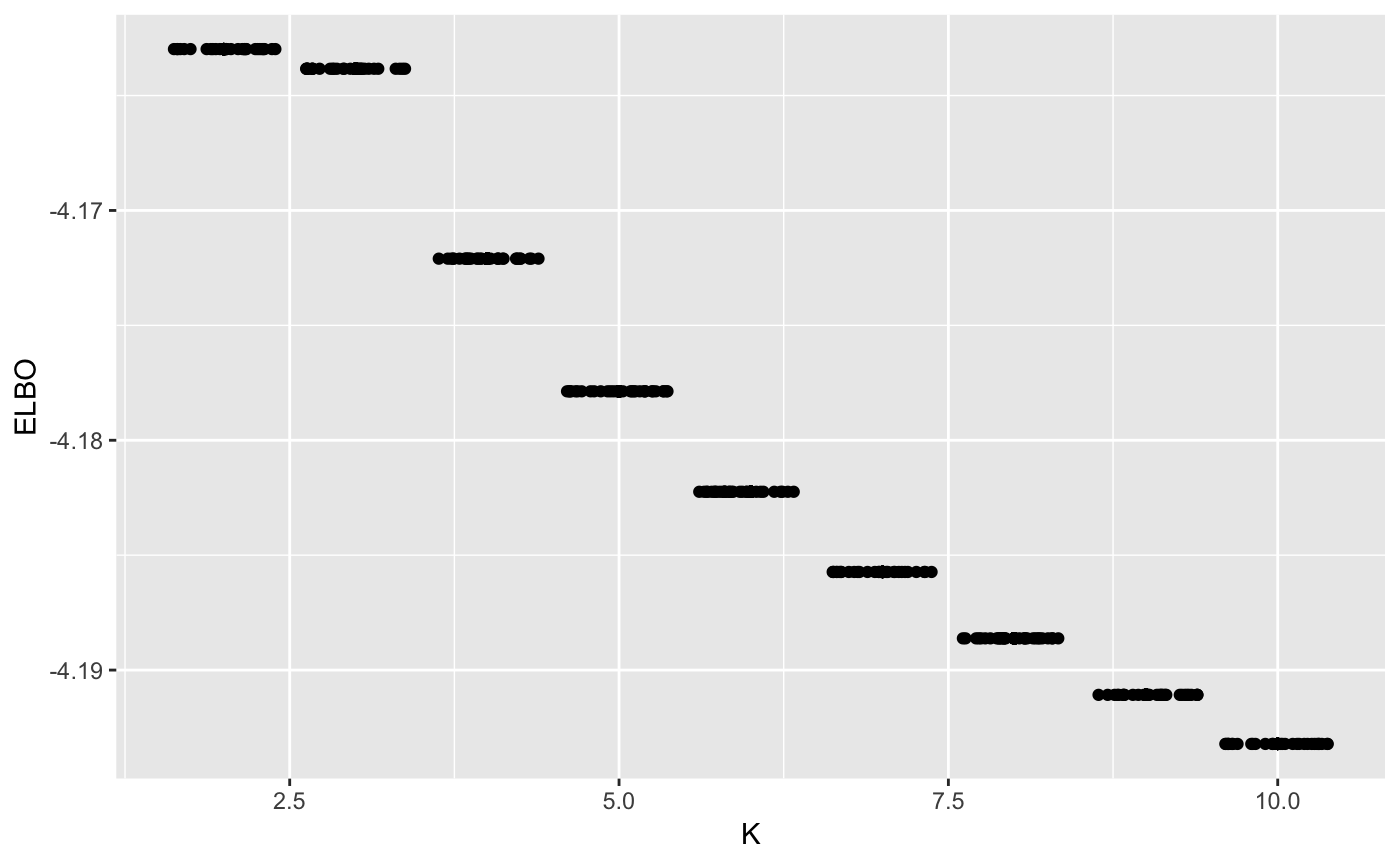
data <- c(rnorm(100,-3), rnorm(100,3))

maxK <- 10
n_random_starts <- 30
ELBO <- matrix(0, maxK-1, n_random_starts)
for(k in 2:maxK){
    for(j in 1:n_random_starts){
        output <- vimix(data, K = k)
        ELBO[k-1,j] <- output$L[length(output$L)]
    }
}

library(reshape)
ELBO <- melt(t(ELBO))
names(ELBO) <- c('start_n', 'K', 'ELBO')
ELBO$K <- ELBO$K + 1

ggplot(ELBO, aes(x = K, y = ELBO)) + geom_point() + geom_jitter()